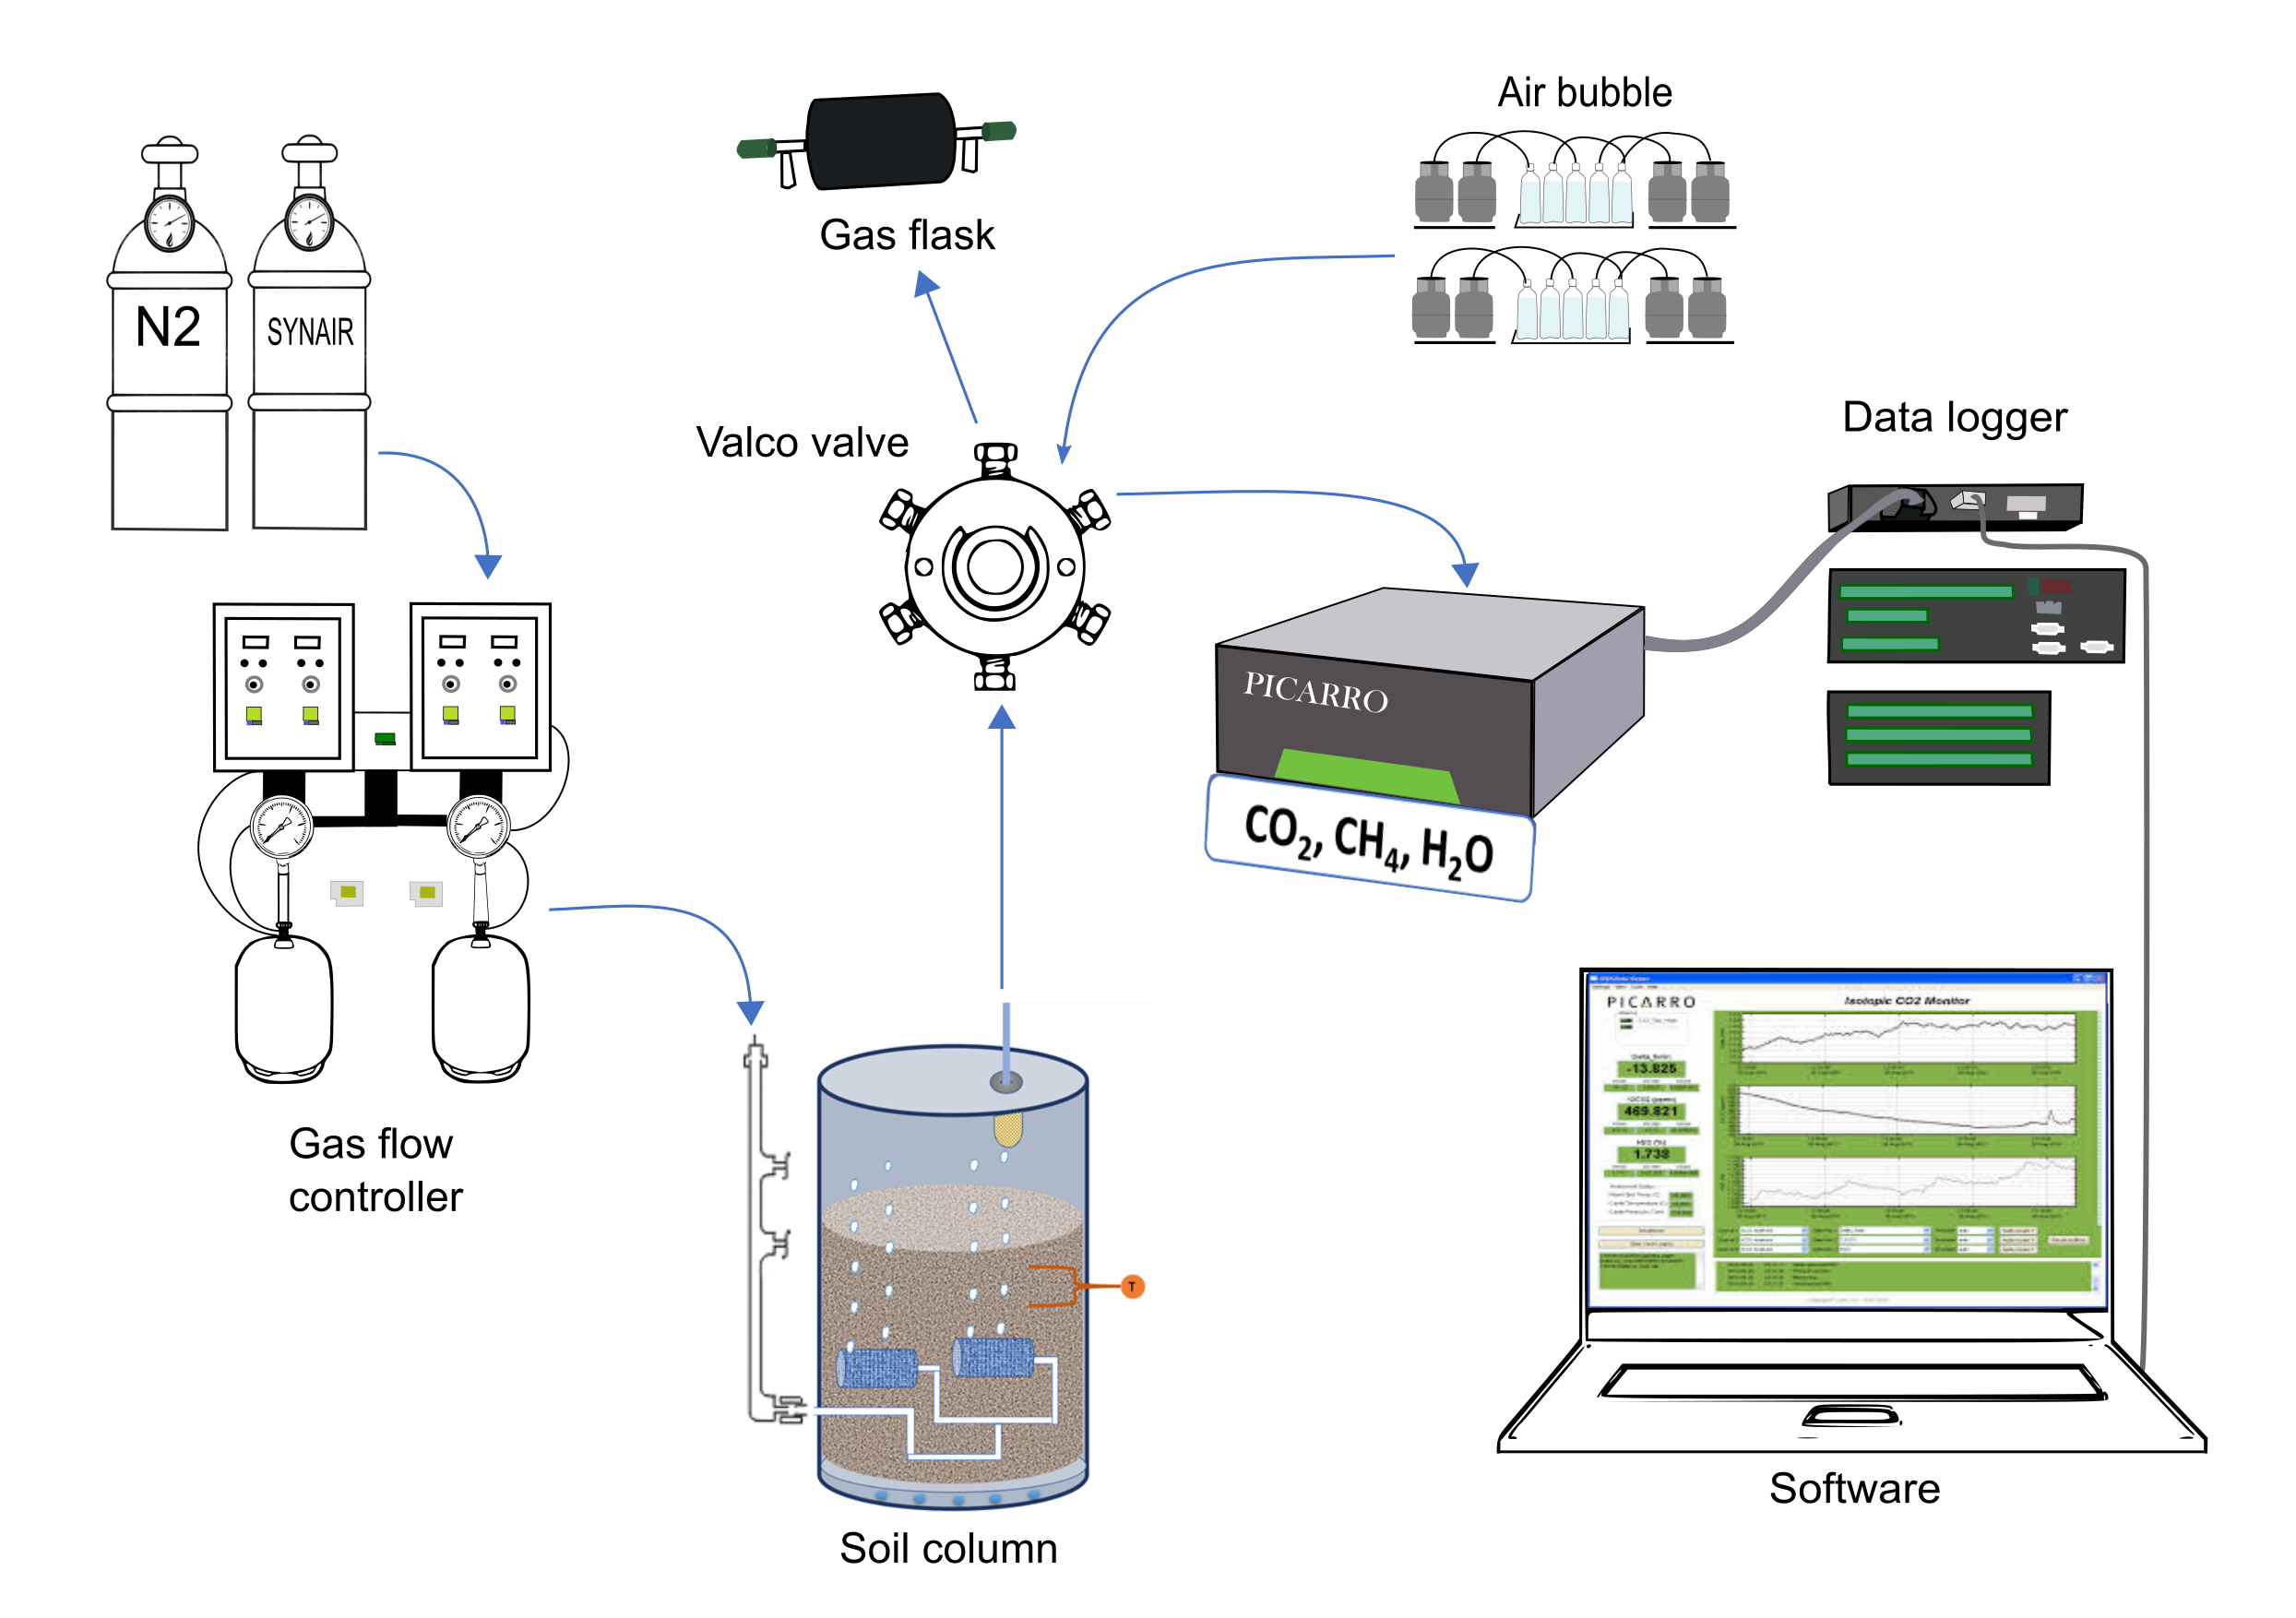
This diagram depicts a laboratory incubation system with its main components. It was commissioned by the Max Planck Institute for Biogeochemistry.
We worked together with the scientist who ran the experiment, who first gave us an initial diagram in Power Point, together with some pictures of the measurement intruments. We moved all graphical content to vector graphics and created different versions that were discussed with the scientists.
This version has been already used in scientific presentations, and is part of a research manuscript currently under preparation.